MyCasita: the $6 sensor that found mold in my ceiling
A self-hosted temperature, humidity and dew-point logger on a Wemos D1 mini — and how three weeks of its data tracked a musty smell to condensation in a sealed roof cavity.
It started with a smell. A small guest casita I'd just finished re-siding had a faint, persistent musty note — the kind that means moisture is sitting somewhere it shouldn't. The problem with "it smells musty" is that you can't act on it. You can't tell whether the mini split is helping, whether opening a window dries the room or soaks it, or whether anything you try is working. So before I touched a single wall, I built a thing to measure it.
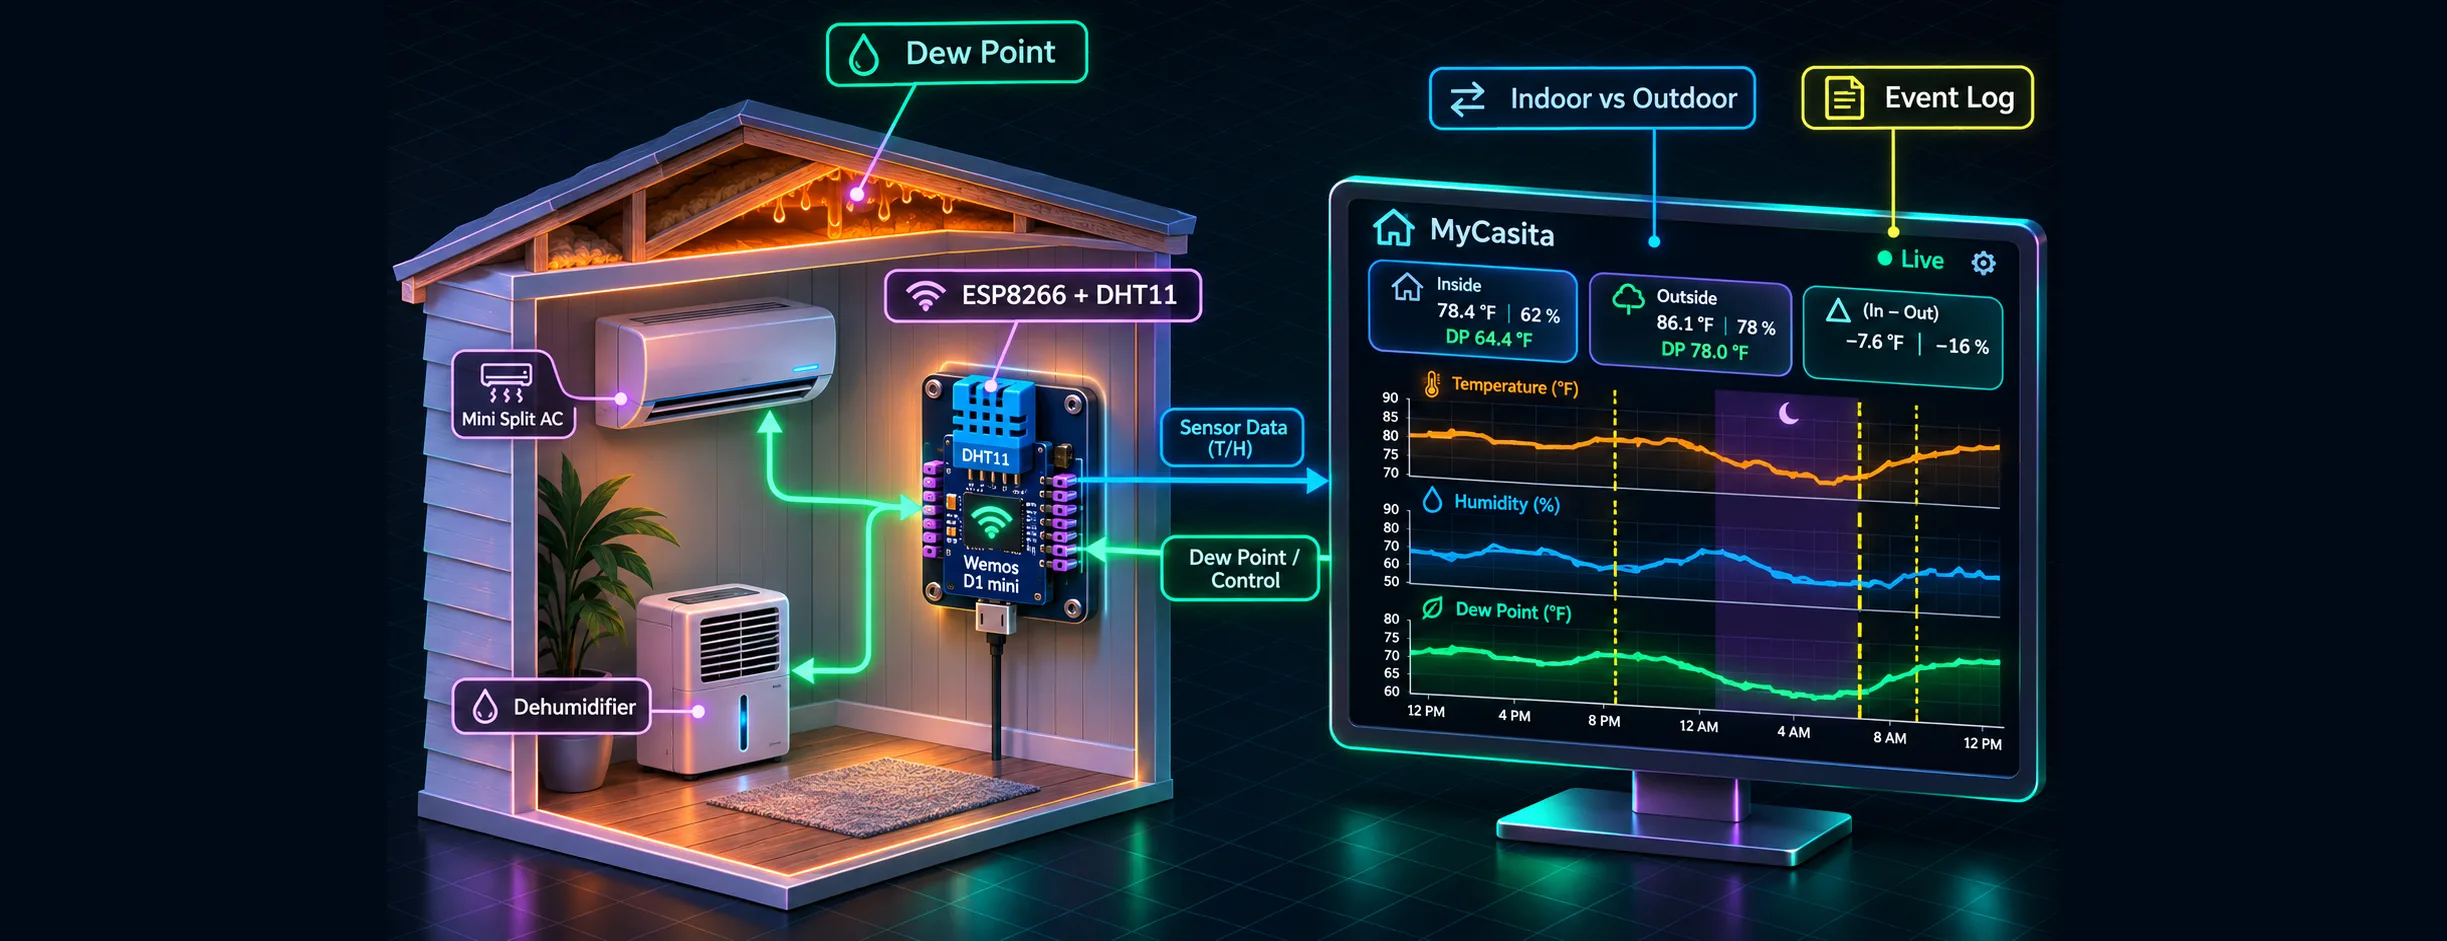
MyCasita is a WiFi temperature/humidity logger on a Wemos D1 mini (ESP8266). It serves its own dashboard at http://mycasita.local, computes the dew point, pulls outdoor conditions for the location so you can compare inside vs. outside, lets you annotate the charts with events ("installed dehumidifier"), and keeps a month of history in flash that survives reboots. No cloud account, no app, no external assets — everything runs on the board. The only outside call is Open-Meteo's free, keyless weather API.
Three weeks later, that little board's data is what found the actual source of the smell. This is how it's built, and how it earned its keep.
The hardware
There's almost nothing to it, which is the point.
| Part | Notes |
|---|---|
| Wemos / LOLIN D1 mini | ESP8266EX @ 80 MHz, 4 MB flash (~1 MB app, 1 MB LittleFS, rest for OTA), 80 KB RAM, micro-USB |
| LOLIN DHT11 shield | Stacks straight onto the D1 mini; data on D4 (GPIO2). No wiring |
| 5 V micro-USB supply | Any phone charger; the board draws well under 100 mA |
Solder the stacking headers, plug the shield on top, done. The firmware also builds for a DHT22 or an I²C SHT30 shield if you want real accuracy — the DHT11 is the entry-level part, and it matters which one you trust:
DHT11 (what I used)
±2 °C temperature, ±5 %RH humidity, 1% resolution. Cheap and stacks for free. Good for trends — is it getting wetter or drier, did the AC change anything — but not for absolute numbers, and least reliable above ~80 %RH.
- Dew point error: the ±5 %RH drags dew point to roughly ±2 °C
- Build flag:
pio run -e d1_mini -t uploadOne placement note learned the hard way: don't stack the sensor directly over the ESP8266 if you can avoid it. The WiFi chip warms the shield a degree or two, so the board reads a little high on temperature and low on humidity. Mount it at chest height, out of the sun, away from the mini split's airflow.
Where to buy
It's all the LOLIN (Wemos) D1 mini ecosystem — cheap, open, and sold worldwide. Prices drift and these are just representative sellers, so check the listing before you order:
| Part | Rough price | Where |
|---|---|---|
| LOLIN D1 mini (ESP8266) | ~$5–16 | official docs · Universal Solder · PMD Way · TinyTronics |
| DHT11 shield (what I used) | ~$3–6 | Universal Solder · Hobbyelectronica · Envistia Mall |
| SHT30 shield (accurate upgrade) | ~$5–14 | official docs · TinyTronics · Universal Solder · PMD Way |
Plus any 5 V micro-USB phone charger. There's also a DHT22/AM2302 shield that drops onto the same D4 pin if you want better accuracy than the DHT11 without going I²C. The boards are also all over AliExpress, Amazon and eBay — search the exact part name. Most are clones; the function is identical, just confirm it's a 4 MB flash D1 mini.
Dew point is the real signal
Here's the thing that makes the whole project work: relative humidity lies. RH drops as a room warms even though the amount of water in the air hasn't changed, so "60% RH" tells you almost nothing on its own. The number that actually tracks moisture is the dew point — the temperature at which that air would start condensing.
The board computes it from temperature and RH with the Magnus formula:
// psychro.h — dew point from temperature (°C) and relative humidity (%)
static inline float dewPointC(float tempC, float rh) {
  const float a = 17.62f, b = 243.12f;         // Magnus coefficients
  float gamma = logf(rh / 100.0f) + (a * tempC) / (b + tempC);
  return (b * gamma) / (a - gamma);
}
And the single most useful comparison on the dashboard is indoor dew point vs. outdoor dew point:
- Indoor dew point higher → outside air is drier. Opening up or ventilating will dry the room.
- Outdoor dew point higher (a normal Florida afternoon) → outside air brings moisture in. Keep it closed and let the AC or dehumidifier work.
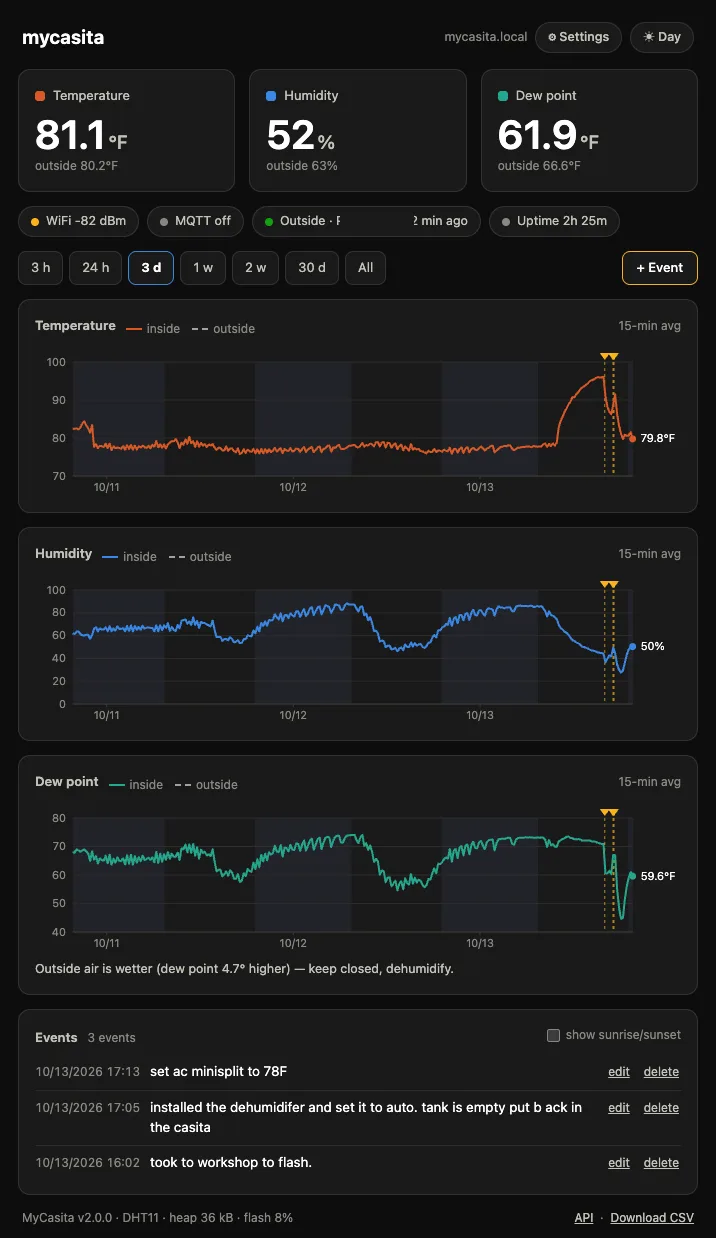
That one rule turned "should I open the window?" from a guess into a reading. The board fetches current conditions from Open-Meteo every 15 minutes and logs them next to every indoor sample, and under the dew-point chart it just tells you which way the gradient points.
Logging events on the chart
Measuring is only half of it. To know whether a change helped, you have to mark when you made it. Every time I did something — turned on the dehumidifier, set the mini split to 76°F, opened the door to air it out, ran the ozone generator — I dropped an event on the chart. They render as dashed amber lines across every graph; hover for the text, and the whole history lines up against the things I actually did.
That's a one-line HTTP call, which meant I could script it — and even have an assistant post events on my behalf while I worked:
# mark an event now
curl -X POST http://mycasita.local/api/events \
  -H 'Content-Type: application/json' \
  -d '{"text":"installed dehumidifier, set to 45%"}'

# or at a specific time, reconstructed from the data later
curl -X POST http://mycasita.local/api/events \
  -H 'Content-Type: application/json' \
  -d '{"text":"closed up after air-out","ts":1791900000}'
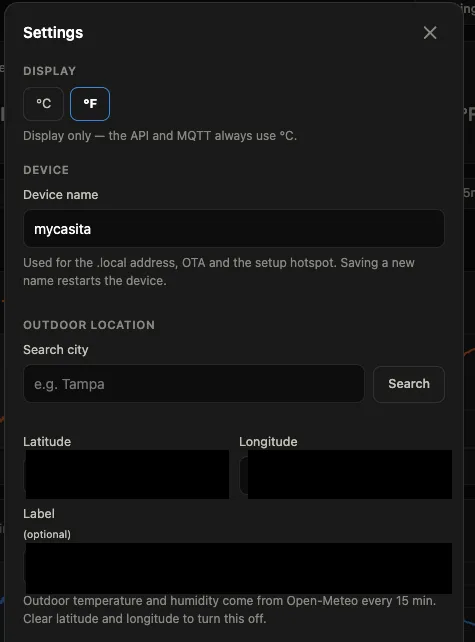
With a location set, the board also shades every chart between sunset and sunrise — computed on the board with the NOAA solar algorithm, so the bands appear even for old data. Day/night swings stop looking like something you caused.
The hunt: what the data revealed
With equipment running, the room settled into a pattern: indoor dew point parked around 60–62°F and wouldn't go lower, night after night, almost regardless of what the weather did outside. The dehumidifier bucket filled slowly — a sign of a fairly tight shell — and a coast-down showed the room held a 20°F gap against outside for hours. So where was the moisture coming from?
I worked through the suspects the way you'd debug anything, ruling each out with evidence rather than hunches:
- The walls — rock wool, dry when they were closed up. Ruled out.
- The subfloor — raised 6" over an open, well-ventilated crawl. Borescoped it: clean, dry pine, no staining. Ruled out.
- The mini split — cleaned a month earlier; refrigerant lines run straight out the wall, nowhere near the ceiling. Ruled out.
That left the one place nobody had looked: above the finished pine ceiling. A tell showed up in the data and the room together — after two weeks of running the room dry, the ceiling's tongue-and-groove seams had shrunk and gapped, and you could feel air puff out of a gap when the door closed. The cavity was breathing into the room.
So I drilled two inspection holes and ran a borescope up. There it was: white mold across the wood in the roof cavity — the exact space sealed above the ceiling that every air treatment in the room below had never reached. That's why the smell kept coming back "the same, just weaker": I'd been treating the air, never the source.
The mechanism was condensation, not a leak (a roofer confirmed the roof was sound):
- Humid air gets into the unconditioned cavity through soffit gaps.
- The AC chills the ceiling from the room side.
- Warm, wet cavity air hits the cold ceiling and condenses — like sweat on a glass — feeding mold on the wood.
Running the AC harder to fight the smell was quietly making the cold surface colder. The fix was the opposite of everything I'd tried inside the room: seal the humid air out of the cavity and insulate it. Three weeks of dew-point curves, not the smell, are what pointed there — and MyCasita is still logging to tell me whether the repair holds.
How it's built (a firmware tour)
The whole thing is a single main.cpp plus a handful of dependency-free headers, built with PlatformIO. The design goal was nothing gets lost — not across a reboot, not across a power cut mid-write.
Everything runs on the board. The dashboard is one self-contained HTML page in web_ui.h; a pre-build step gzips it so the ESP8266 serves ~13 kB instead of ~42 kB. There's an OpenAPI 3 spec at /openapi.json describing the whole API:
| Method | Path | Returns |
|---|---|---|
| GET | /api/status | Current reading, sensor, outdoor block, device state |
| GET | /api/history | Last 3 h at 1-min resolution (RAM ring buffer) |
| GET | /api/log | Persistent 5-min log rows, optional ?since=&until= |
| GET/POST | /api/events | List / add chart events |
| GET/POST | /api/config | Device, location and MQTT settings |
History is two-tier. A RAM ring buffer holds 3 hours at 1-minute resolution for the live view; a LittleFS log keeps 30–60 days at 5-minute resolution and is re-seeded into RAM on boot. The log is a packed binary format — 12 bytes per record — and logging only starts once NTP has synced, so every record has a real UTC timestamp:
// logfmt.h — one 12-byte record (dew point is recomputed on read, not stored)
struct LogRec {
  uint32_t ts;        // unix seconds, UTC
  int16_t  temp_x10;  // °C × 10   (INT16_MIN = missing)
  int16_t  hum_x10;   // %RH × 10
  int16_t  out_temp_x10;
  int16_t  out_hum_x10;
};
Writes are crash-safe. Logs use a two-file ring; events are written as a complete new copy that's renamed over the old one, so a power cut leaves either the old list or the new one, never a mix. A torn trailing record from a brownout is trimmed at boot. The dew-point math, the sunrise/sunset algorithm, the log format and the event store live in headers with no Arduino dependency, so they're unit-tested on a desktop — against an in-memory filesystem that simulates a power failure at every single write, rename and delete and asserts nothing is lost:
pio test -e native
# replay the migration against a real log dump too:
MYCASITA_LOG_JSON=casita-log.json pio test -e native
There's also a tools/mock_server.py — a dependency-free Python fake of the entire API, seeded from a log dump — so the dashboard can be developed in a desktop browser with no hardware attached. And MQTT is there if you want the readings in Home Assistant, off by default.
Takeaways
- Measure before you fix. I almost started tearing into walls. The data said the walls were fine and sent me to the ceiling instead.
- Dew point, not RH. Absolute moisture and the indoor-vs-outdoor gradient are the signals that actually mean something.
- Annotate everything. Events turned a noisy chart into a record of cause and effect — "did that help?" became answerable.
- A $6 board is enough. The DHT11 isn't accurate, but it's accurate enough for trends, and trends are what solved this.
The code is on GitHub: ril3y/mycasita. Flash it, point it at a room you're suspicious of, and start logging. You might be surprised what the curves tell you.